Use the vNudge Monitoring dashboard to review notification delivery and the current health of vNudge components.
The dashboard provides a central view of notification status, delivery channels, retries, component health, and detected issues.
View the Monitoring Dashboard
Open the vNudge application.
Navigate to Dashboard.
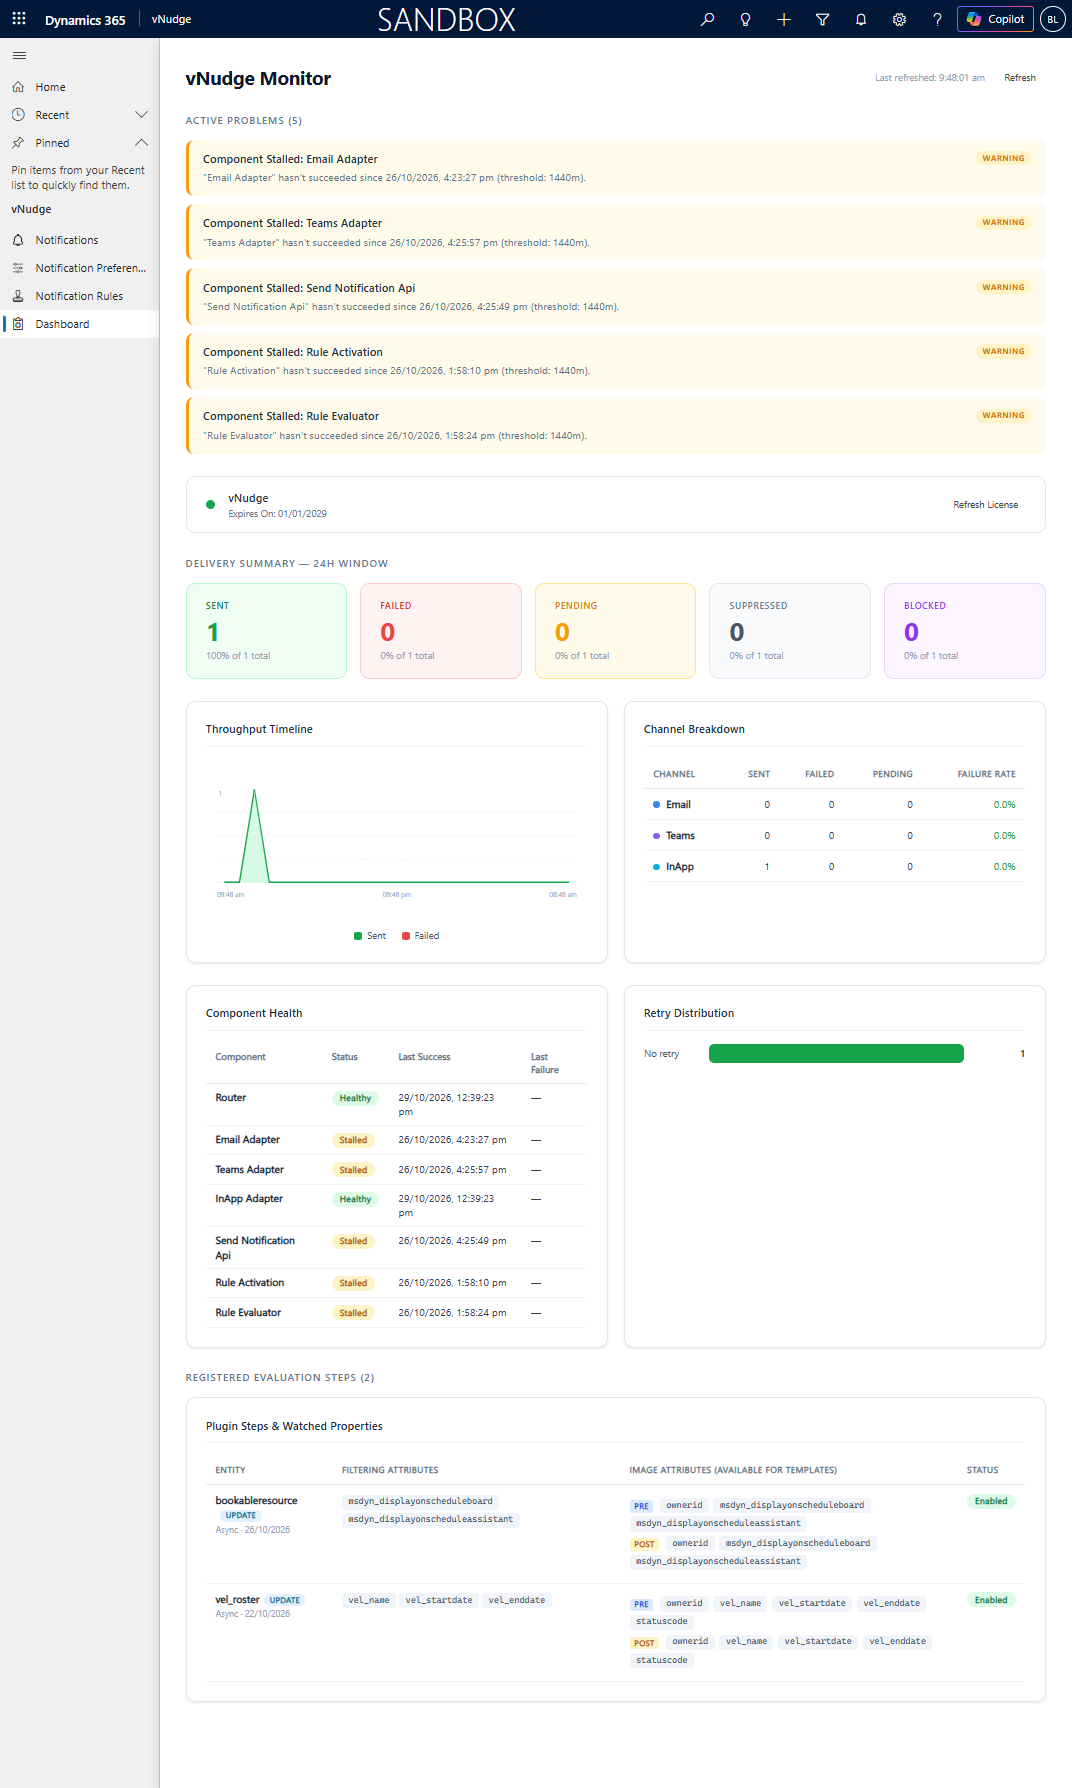
Dashboard Overview
Area | Description |
|---|---|
Active Problems | Displays currently detected issues that may require attention, including the affected component, issue description, and severity. |
License Status | Shows the current vNudge license status and expiry date. |
Delivery Summary | Shows Sent, Failed, Pending, Suppressed, and Blocked notifications for the 24-hour window. |
Throughput Timeline | Shows Sent and Failed notification activity over the 24-hour window. |
Channel Breakdown | Shows Sent, Failed, and Pending notifications for Email, Teams, and In-App, together with the failure rate for each channel. |
Component Health | Shows the current health of each vNudge component, including its status, last successful run, and last failure. |
Retry Distribution | Shows notifications grouped by the number of delivery retries. |
Registered Evaluation Steps | Shows registered plug-in evaluation steps, including the monitored entity, filtering attributes, image attributes available for templates, and whether the step is enabled. |
Refresh the Dashboard
Select Refresh at the top of the dashboard to retrieve the latest monitoring information.
The Last refreshed time shows when the displayed dashboard information was last updated.
Refresh License
Select Refresh License in the License Status section to retrieve the latest vNudge licence information.
The License Status section displays the current licence state and expiry date.
Use Refresh License after a licensing issue has been resolved to confirm that the updated licence is valid before retrying affected Blocked notifications.
Component Health
Component Health provides the current operational status of the main vNudge components.
The dashboard displays:
Component - the vNudge process being monitored.
Status - the current component health, such as Healthy or Stalled.
Last Success - the most recent successful execution.
Last Failure - the most recent failed execution, where available.
The monitored components include:
Router
Email Adapter
Teams Adapter
In-App Adapter
Send Notification API
Rule Activation
Rule Evaluator
Important
Component Health represents the current state of each component rather than a complete execution history.
Registered Evaluation Steps
Registered Evaluation Steps shows the Dataverse plug-in evaluation steps currently registered for Notification Rules.
For each step, the dashboard displays:
Entity - the Dataverse entity being monitored and the event type, such as Update.
Filtering Attributes - the attributes monitored for changes.
Image Attributes - the Pre and Post image attributes available when evaluating rules and resolving notification templates.
Status - whether the evaluation step is enabled.
This section helps administrators confirm which Dataverse entities and attributes are currently registered for Notification Rule evaluation.